MTTD vs MTTR when the failure never raises an error

Quick Overview:
MTTD measures how long a production issue goes unnoticed. Silent failures can run for days behind healthy dashboards and a zero error rate, yet still get logged as detected in minutes. This guide shows how to measure MTTD from the real onset, which checks catch failures that never raise an error, and how to diagnose them once they surface, including with InSitu’s dynamic instrumentation.
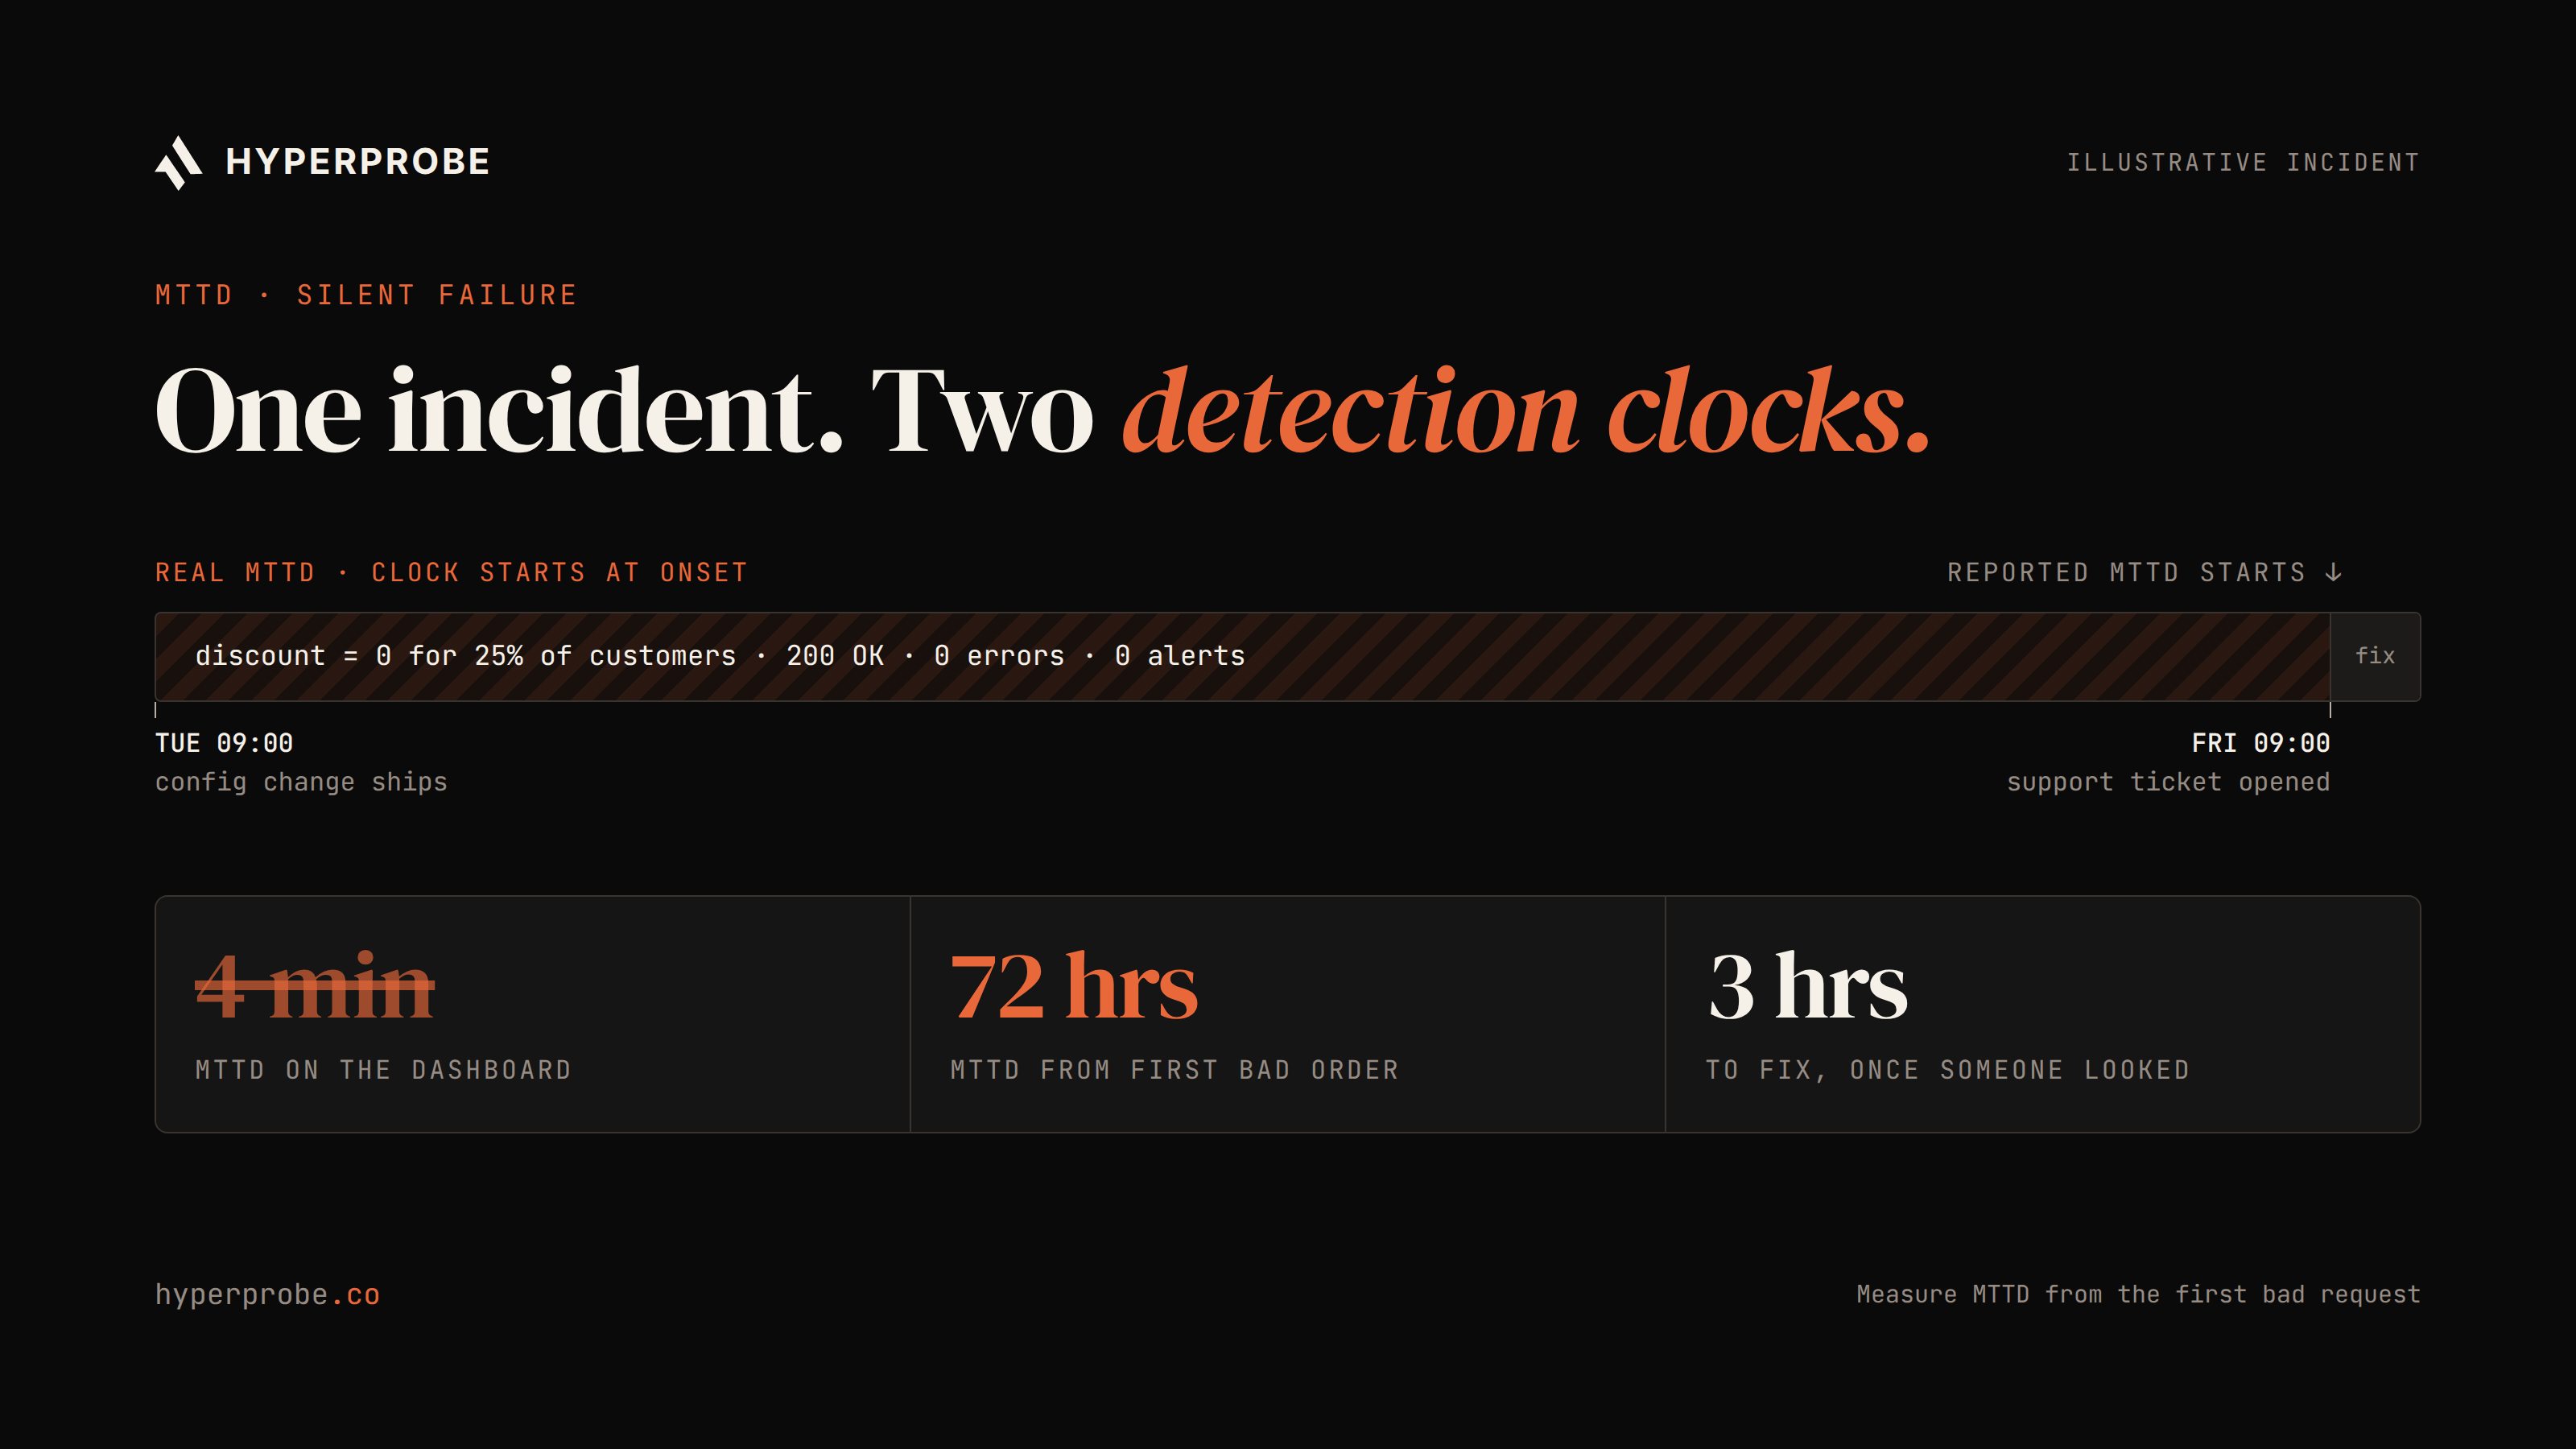
A pricing service ships a config change on a Tuesday. Every request still returns 200, latency holds, and the error rate sits at zero. For three days, though, the discount field comes back as 0 for a quarter of customers. On Friday a support ticket arrives with a screenshot. The dashboard that reports MTTD for the quarter records the incident as detected in about four minutes, because its clock started when someone opened the ticket.
MTTD is supposed to measure how long a problem goes unnoticed. When a failure throws an exception, the alert fires within seconds and the metric holds up. When a failure never raises an error, the onset is invisible, and the reported number only measures how fast the team reacts to a complaint. This guide covers where MTTD and MTTR split, why error-based alerting misses this class of failure, and what it takes to measure and shorten the gap.
What MTTD (mean time to detect) measures
MTTD, or mean time to detect, is the average time from the moment a problem begins to the moment a person or a system first notices it. The formula is the sum of detection times across incidents divided by the number of incidents. Three incidents that went unnoticed for 5, 11 and 9 minutes give an MTTD of 8.33 minutes.
The key word in that definition is begins. TechTarget defines the start as the point when the problem starts, and the NIST glossary describes MTTD as the average time a problem remains undetected before it is found. Neither definition mentions an alert. A customer report counts as detection too, and SUSE's comparison lists stakeholder reports as a valid detection source.
MTTD sits inside MTTR whenever the recovery clock starts at impact. AWS notes that organizations place the MTTR start and stop points differently, and our guide on the four versions of MTTR walks through each one. The version that matters here starts when users were first affected, because that is the only version a silent failure can inflate.
Where MTTD and MTTR split
The two metrics answer different questions and respond to different investments.
| MTTD | MTTR | |
|---|---|---|
| Clock starts | Problem onset | Onset, or detection, depending on the definition |
| Clock stops | First detection | Service confirmed healthy |
| Moves the number | Monitoring coverage | Diagnosis and remediation speed |
| Usually owned by | Platform or observability team | On-call engineer and service owner |
A team can post a strong MTTR and a poor MTTD for years without noticing. Incident tooling opens the ticket at detection and measures everything after it, so the time before detection never shows up. For loud failures that gap is small. In published incident studies, detection accounts for roughly a tenth of resolution time while debugging takes well over half.
That split comes from incidents that produced a signal. When the failure produces none, detection stretches from minutes to days while debugging stays about the same length. No published dataset covers silent failures on their own, but the pricing example shows what happens. Seventy-two hours undetected plus three hours to fix means 96% of that incident's MTTR passed before anyone knew it existed.
Why error-based monitoring misses silent failures
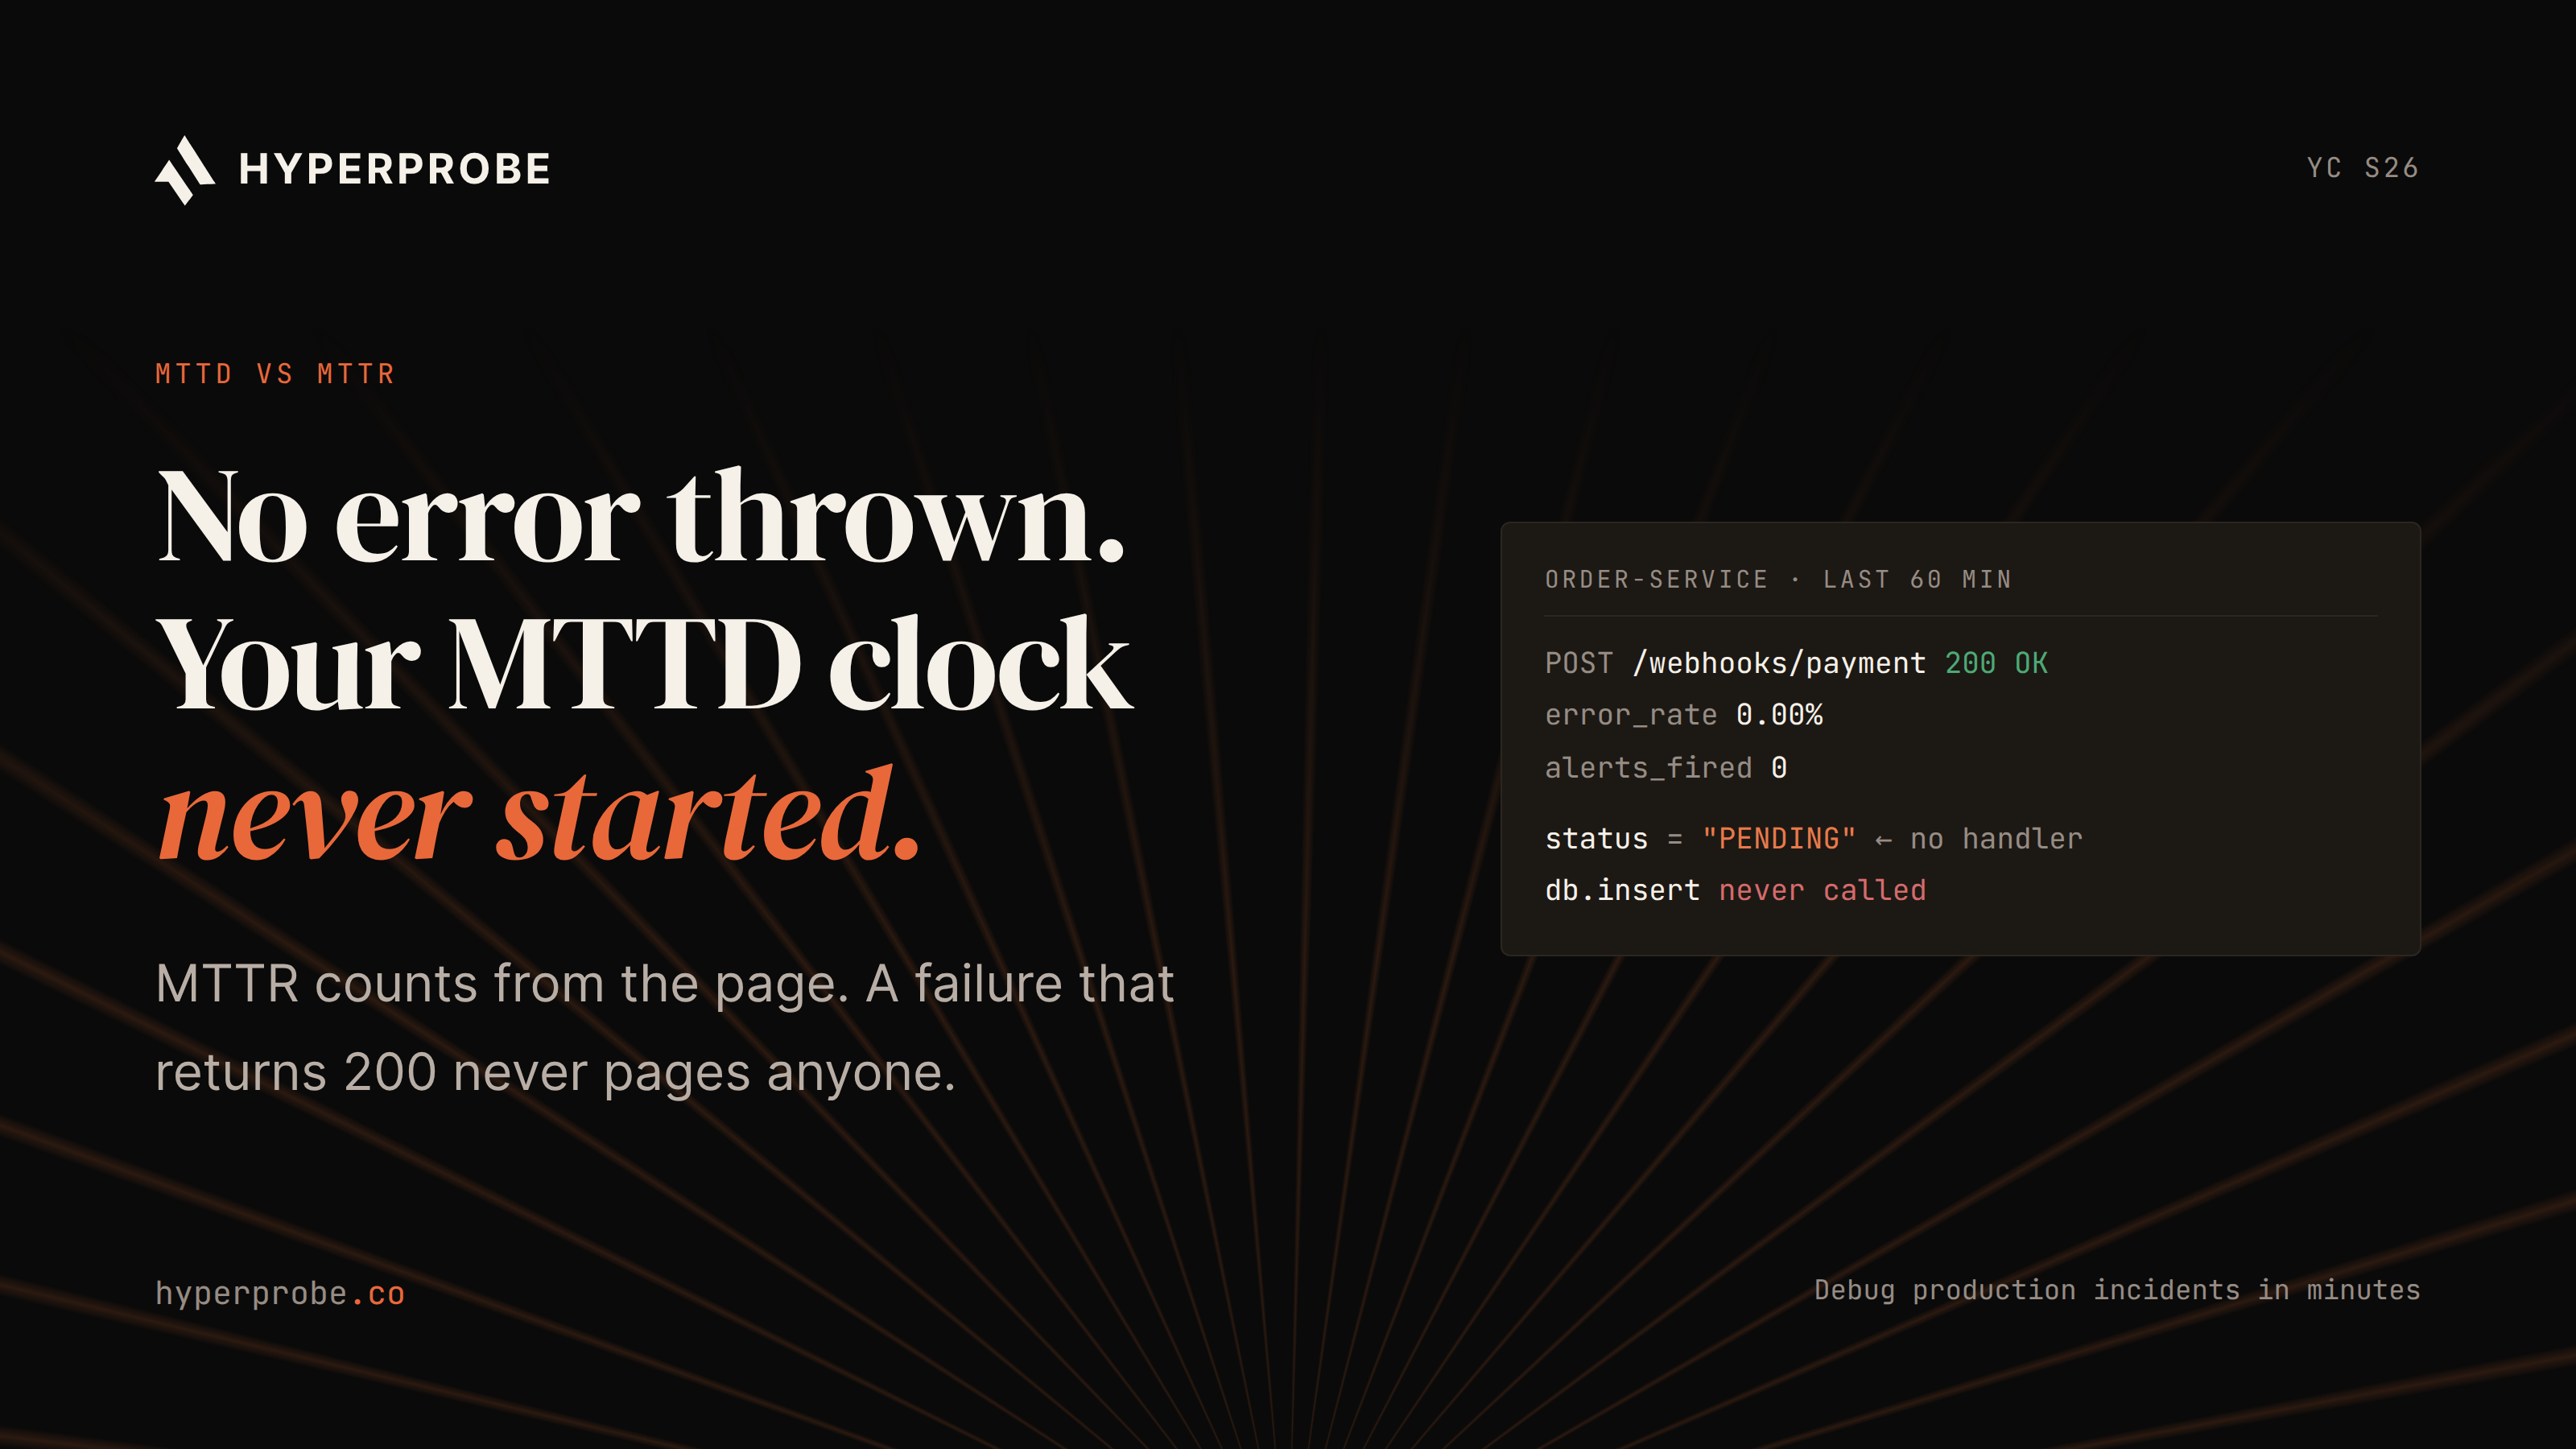
Alerting pipelines need an event to evaluate. An exception or a 5xx gives the pipeline something to compare against a rule. A correct-looking response with a wrong value inside it gives it nothing.
The gap is wider than many teams assume. A 2026 survey of more than 1,000 SRE, DevOps and IT professionals found that 78% of organizations had at least one incident where no alert fired. In the same survey, nearly 40% of incidents were discovered by customers before the engineering team knew anything was wrong. An earlier Netrounds survey of 400 US companies found that over 60% of network brownouts were first spotted by someone other than IT.
Health checks are part of the reason. A dependency check usually tests whether a service responds, and rarely whether it responds correctly. An identity provider returning 200 with stale tokens passes a liveness probe, and so does a payment gateway that accepts requests and holds them in a queue. Absence is the other reason. A consumer that stops consuming emits no event, so there is nothing for a rule to match.
The Google SRE book argued years ago that paging should be driven by symptoms rather than causes, and that black-box probes should check the content of a response, not only its status. Teams that alert on exceptions have built cause-based detection and called it coverage.

Four silent failures backend teams meet
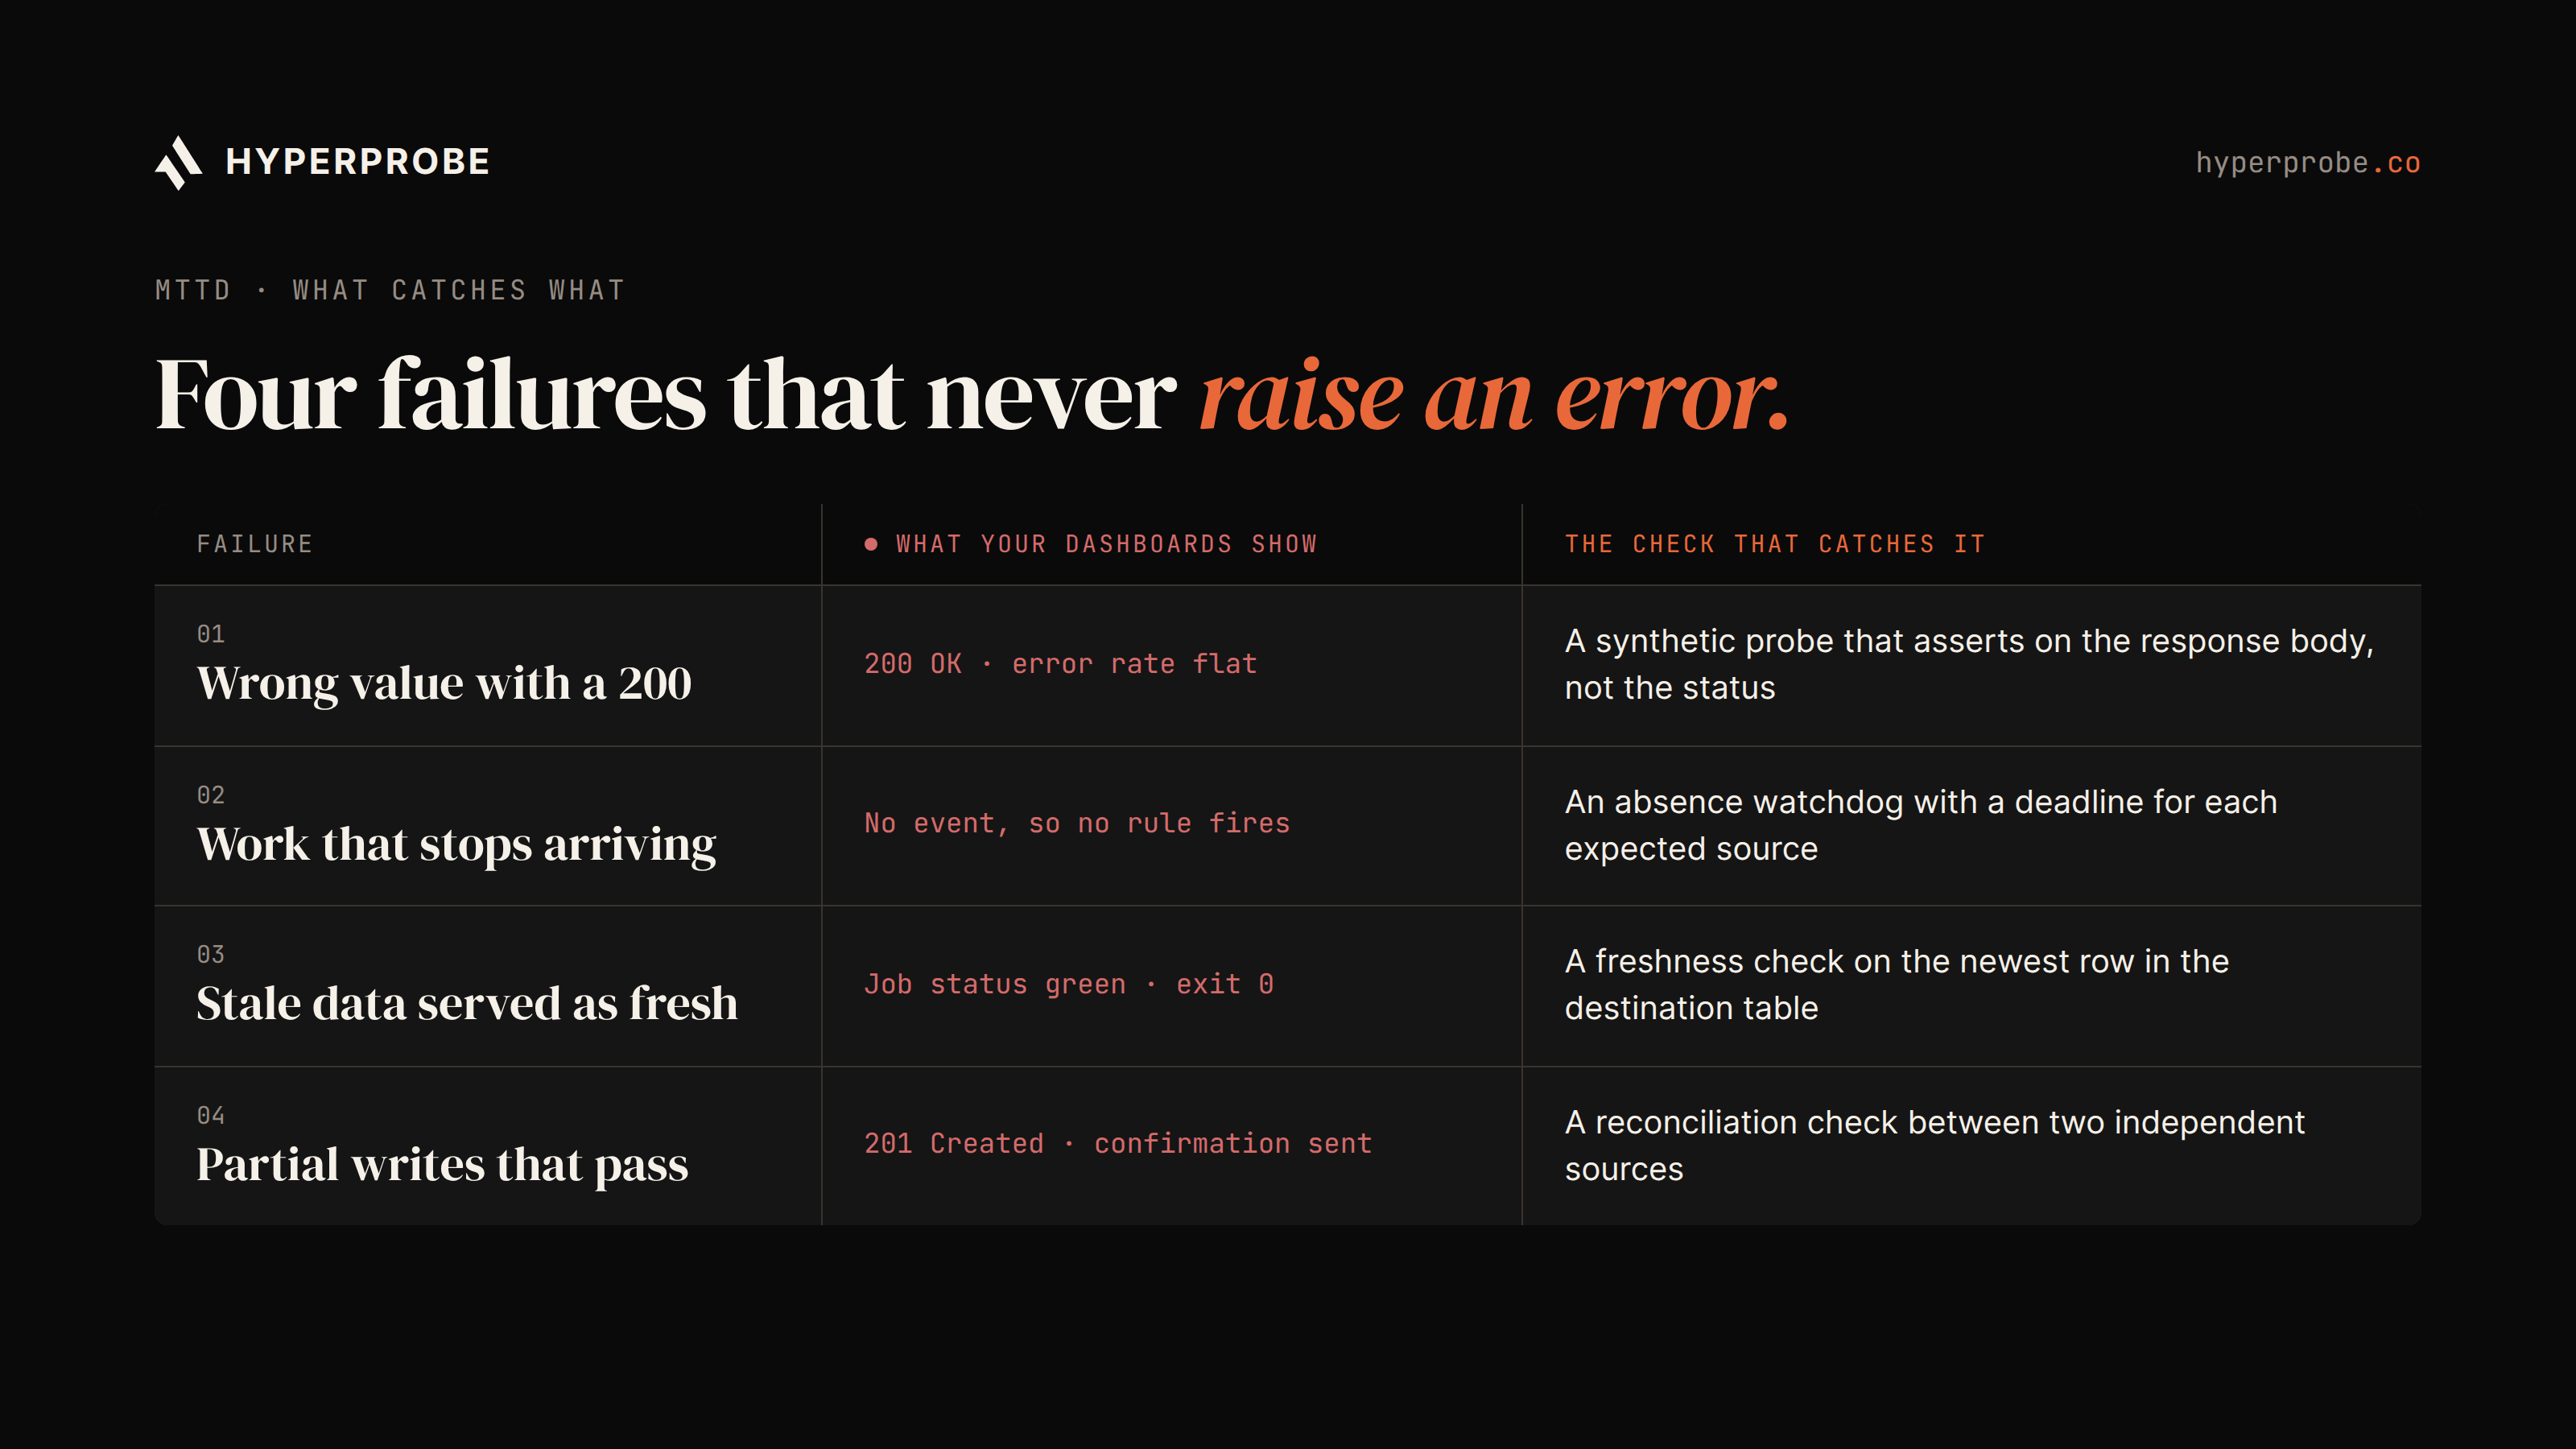
Wrong value with a 200
A feature flag defaults to the wrong branch, or a config loader falls back to a stale default after a schema change. The handler runs to completion and logs nothing unusual. It returns a price or a permission that is wrong, and the error rate stays flat because nothing erred.
Work that stops arriving
A queue consumer picks up a deploy that changes a serialization format and starts acknowledging messages it cannot parse. Lag grows on a graph nobody has a threshold for. Downstream reports go quiet in a way that looks like a slow day until someone compares it with last week.
Stale data served as fresh
A cache key stops being invalidated, or a nightly job exits 0 after writing an empty file. Pipeline dashboards show green because they read job status. A freshness check that reads the newest row in the destination catches it, and so does a declared deadline for each expected source.
Partial writes that pass
A transaction commits the order row while a row-level security rule filters the audit insert down to zero rows. The API returns 201 and the customer sees a confirmation. Weeks pass before finance notices that the ledger and the orders table disagree.
How to measure MTTD from onset
Start by reconstructing the true onset from data instead of the alert timestamp. Rapid7 lists treating alert time as detection time as a common pitfall, and for silent failures that gap is the entire incident. The first bad row, or the deploy that introduced the change, can usually be found after the fact.
-- true onset for the discount incident: first order with a zero discount
-- on a plan that should always carry one
SELECT MIN(created_at) AS onset
FROM orders
WHERE plan IN ('pro', 'team')
  AND discount_cents = 0
  AND created_at > now() - interval '14 days';
Next, tag every incident with how it was found: a monitor, an engineer, or a customer. Pagerly suggests computing that distribution across recent incidents, calling it a number few teams have ever calculated. If close to 40% of your incidents were found by people, detection coverage is a better place to spend effort than response time.
Then report MTTD for loud and silent failures separately. A median built from exception-driven incidents will sit at a few minutes and hide a tail measured in days.
Shrinking MTTD for silent failures
Wider coverage shortens MTTD for silent failures. Tighter thresholds on error metrics that never move will not. Google's incident management guidance recommends alerts tied to SLOs that reflect user experience rather than internal behavior. In practice that means alerting on a checkout success rate or a fulfilled-orders count rather than a CPU percentage.
Reconciliation checks compare the same quantity from two independent sources and alert when they drift apart. The Software Engineering Guide's chapter on data observability treats invariants such as non-null keys and expected row counts as tests that should run in production as well as in CI. Absence watchdogs with a deadline per expected source catch consumers and cron jobs that stop. Synthetic probes that assert on the response body catch the wrong-value class.
None of this replaces the APM, logging or error tracking you already run. It adds the checks those tools were never asked to make.
What happens to MTTR after detection
Finding a silent failure does not make it easier to explain. An exception arrives with a stack trace and a line number. A wrong value arrives with neither. The engineer knows the output is wrong and has to work backward to the point where a correct input became an incorrect output. That almost always means needing a variable that was never logged.
The usual route is to add a log line, redeploy, wait for the condition to recur, and repeat with the next variable. Our breakdown of where incident hours go shows information collection as the largest share of debugging effort. Our guide on reducing MTTR on a backend service covers why each redeploy cycle costs more than it looks.
Dynamic instrumentation takes the redeploy out of that loop. It captures a variable from the running service at the moment the condition occurs, and our guide on capturing a variable that was never logged compares it with the other options. Our on-call agent starts from the detected symptom and places read-only probes on the suspect lines. Each probe is bounded by a time to live and a rate limit, and PII is redacted at the agent before anything leaves your service. The captured values come back as evidence for the root cause. Your engineer confirms the cause and commits the fix, and your existing observability stack keeps doing its job.
Silent failures suit this approach for one practical reason. They are usually still happening when someone finally notices. The discount bug was still returning 0 on Friday, so the next affected order would have hit the probe within minutes. A probe cannot find a failure nobody has noticed yet, though, and it only captures what runs after it is placed. Detection coverage stays your job. We make the diagnosis that follows it shorter.
Start with the last customer-reported incident
MTTD computed from alert timestamps describes how quickly a team answers the phone. MTTD computed from onset describes how long customers lived with a problem nobody saw. For silent failures, those two numbers can differ by days.
Pick the last incident a customer reported. Reconstruct its true onset from data and compare it with the detection time on your dashboard. That difference is where to spend your next detection checks. When the next silent failure surfaces, the diagnosis still needs the value nobody logged. You can install the InSitu SDK on one service for free, and the first real incident we work through with you costs nothing.
Debug production in minutes. Book a demo.
Frequently asked questions
What is the difference between MTTD and MTTR?
MTTD (mean time to detect) measures the average time from when a problem begins to when a person or a monitor first notices it. MTTR measures the average time from onset, or from detection depending on the team's definition, to the point where the service is confirmed healthy. MTTD is shortened by detection coverage; MTTR is shortened by faster diagnosis and remediation. When MTTR starts at onset, MTTD is its first segment.
How do you calculate MTTD?
Add up the detection time for every incident in a period and divide by the number of incidents. Detection time runs from the true onset of the problem, such as the first bad row or first affected request, to the first moment someone or something flagged it. Three incidents undetected for 5, 11 and 9 minutes give an MTTD of 8.33 minutes. Using the alert timestamp as the start point understates the metric, especially for failures that never raised an alert.
How can you tell if your MTTD is understated?
Check where the clock starts. If your incident tooling records detection as the moment a ticket or alert was opened, MTTD is measuring reaction time rather than detection time. Tag each incident with its detection source (monitoring, internal human, external human) and reconstruct the real onset from data for the human-detected ones. A 2026 survey of over 1,000 practitioners found nearly 40% of incidents were discovered by customers first, and those incidents carry the hidden detection time.
Why does error-based monitoring miss silent failures?
Alerting pipelines evaluate events, and a silent failure produces none. A wrong value returned with a 200 status, a consumer that stops consuming, or a job that succeeds with zero rows does not raise an exception or breach an error-rate threshold. Health checks confirm a service responds, rarely that it responds correctly. Catching these failures needs symptom-based SLO alerts, reconciliation checks between independent sources, freshness and absence watchdogs, and probes that assert on response content.
What is the difference between MTTD and MTTA?
MTTD covers the time from problem onset until it is detected by anyone or anything. MTTA (mean time to acknowledge) covers the time from an alert firing until an on-call engineer acknowledges it. MTTA only exists once an alert exists, so for a failure that never raises an error, MTTA can look excellent while MTTD runs for days.
RELATED READS